Opening Range Breakout Probability
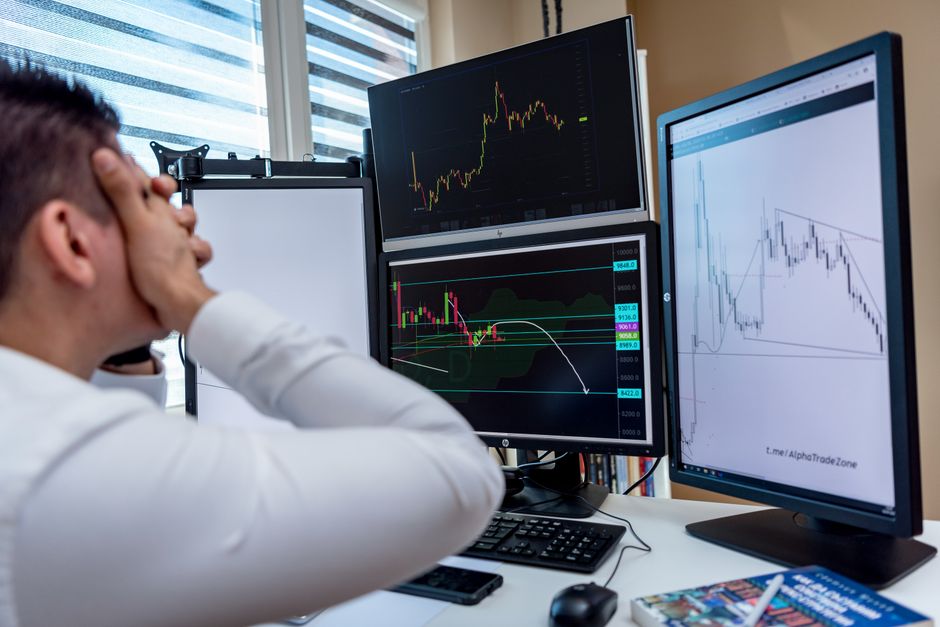
The screech of a floor trader's headset often signals the start of intense data collection, and the raw data processed at orb trading stats tree63 provides the basis for calculating the opening range breakout probability. This specific statistical calculation measures how often a price movement exceeds the initial boundaries established at the cash open. By looking at the historical frequency of these moves, the math determines if a specific timeframe offers a measurable edge over random chance.
Calculating the Breakout Frequency

The process begins by defining the exact boundaries of the opening range. A trader selects a specific window, such as the five minute range, and marks the session high and session low. Once these levels are set, the intraday price action is tracked to see if the candle closes outside that perimeter. To calculate the probability, the number of successful breakouts is divided by the total number of trading days in the sample set. A small sample overstates the edge, so a minimum of two hundred days of data is required for any meaningful calculation. This mechanical approach removes guesswork from the execution of the strategy.
Impact of the Chosen Timeframe

Selecting the correct time frame changes the resulting probability significantly. A 5 minute breakout might occur more frequently, but the magnitude of the subsequent move often lacks the volatility found in a 15 minute range. Conversely, the thirty minute range provides more stability, yet it reduces the number of available setups per month. The math shows that as the duration of the initial window increases, the probability of a breakout tends to decrease, while the potential for a sustained trend increases. The data must be logged according to the specific minutes used to avoid mixing variables.
Variables in Probability Modeling
The volatility of the premarket session often dictates the character of the opening bell. High premarket volume typically leads to wider initial ranges, which can suppress the likelihood of an immediate opening range breakout. The calculation must account for the relationship between the overnight session volatility and the opening range size. If the opening range is disproportionately large compared to the average daily range, the breakout probability drops. Recording the relative size of the range is a standard part of the logging process.
Data Integrity and Sample Size
Accuracy depends on the consistency of the measurement. Using the sixty minute range for one month and then switching to a shorter window for the next month invalidates the entire data set. Every entry must follow the same rules regarding what constitutes a valid breakout. A breakout is only counted if the price stays outside the range for a set number of subsequent candles. This prevents false signals from being recorded as successes. Strict adherence to these mechanical rules ensures the resulting statistics reflect actual market behavior rather than noise.