The False Breakout Trap
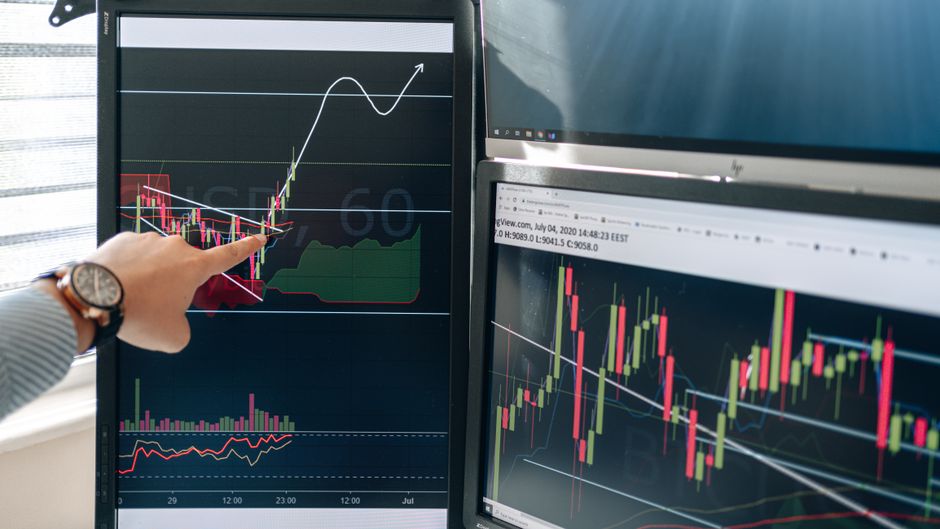
Traders often enter a position the moment a candle touches the boundary and ignore the historical probability of a wick. The data at orb trading stats tree63 confirms that a false opening range breakout occurs more often than a sustained trend begins. This specific type of intraday failure happens when price pierces the high or low of the initial period before the momentum actually shifts. Measuring the frequency of these failed attempts requires looking at the specific way price interacts with the first fifteen minutes of the session.
The Mechanics of the False Breach

A price move that exceeds the boundary of the five minute range by a small margin often triggers liquidity orders. These orders pull the price back toward the mean. The statistical frequency of this reversal is high. A candle might show a long upper wick that clears the session high but closes back within the established bounds. This action signals that the buyers lacked the volume to sustain the move above the established level. Many traders mistake this initial probe for a true breakout. The math shows that a single candle breach does not constitute a trend.
Timeframe Sensitivity and Reversals

The success rate of a breakout changes depending on the chosen timeframe. A breach of the fifteen minute range carries different weight than a breach of the thirty minute range. In many cases, the first hour provides the true direction, but only after the initial volatility of the market open has subsided. Small samples of price action often lead to incorrect conclusions about direction. Looking at the sixty minute range provides a broader view of where the actual support and resistance levels sit for the day. The data suggests that the smaller the initial window, the higher the probability of a false move.
Volume and Liquidity Traps
Liquidity often clusters just outside the opening range. High volume at these levels frequently represents the absorption of orders rather than the start of a new leg. When the price moves into these zones during regular trading hours, it often hits a wall of resting orders. This creates a trap. The price moves past the level, triggers stops, and then reverses rapidly. This mechanical process is a standard part of market microstructure. It is not a random event. It is a repeatable pattern of liquidity seeking and exhaustion.
Statistical Edge in Reversals
The edge lies in identifying the difference between a breakout and a liquidity grab. A true move maintains volume and closes outside the range. A false move shows a lack of follow through. Testing these parameters across different assets shows that the failure rate is a constant factor. The work involves measuring the distance of the pierce relative to the total range. A shallow pierce is more likely to result in a quick reversal. A deep pierce with high volume is more likely to be a legitimate shift in price direction.