Relative Volume Thresholds

Two volume bars that look identical on a chart can represent vastly different levels of institutional participation. The analysis found in the notes at orb trading stats tree63 covers the mechanical requirements for setting relative volume thresholds during an opening range breakout. Validating an intraday signal requires a specific multiplier against the premarket average to ensure the move carries weight. Relying on raw numbers without a relative baseline leads to false signals during low liquidity periods.
Calculating the Volume Multiplier

A standard approach involves comparing the volume of the first five minute range against the average volume of the previous ten premarket intervals. A multiplier of 2.0 or higher typically signals legitimate interest. If the volume at the market open does not exceed this threshold, the breakout lacks the momentum needed to sustain a trend. Measuring the volume against the average volume of the prior five sessions during the same timeframe provides a more stable benchmark. This prevents skewed data from a single quiet morning from distorting the math.
Timeframe Selection and Volume Density
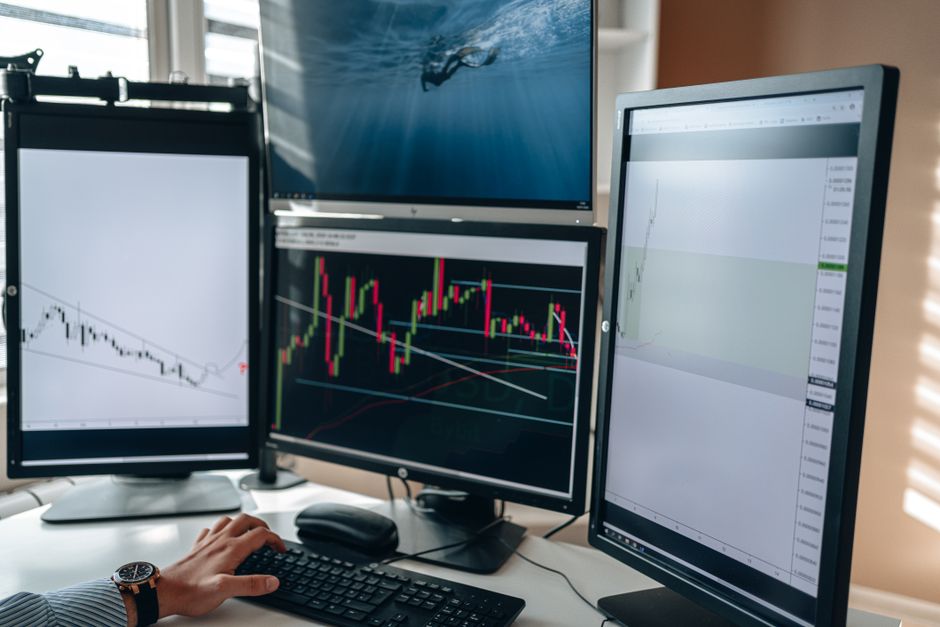
The choice of timeframe dictates the necessary volume density. A 5 minute signal requires a much higher relative surge to be valid compared to a 30 minute range. When looking at the fifteen minute range, the cumulative volume must show a significant spike relative to the average volume seen during the first hour of regular trading hours. Low volume breakouts often fail because they lack the participation required to move the session high. Data shows that a breakout on 1.5x volume is significantly less likely to hold than one on 3.0x volume.
The Role of Premarket Activity
Premarket volume serves as the denominator for most relative calculations. High premarket activity often leads to a compressed opening range, which requires even higher relative volume to break out of the established boundaries. If the premarket volume is exceptionally high, the threshold for a valid orb signal must be adjusted upward to account for the already exhausted liquidity. A failure to adjust this multiplier results in taking trades that are merely echoes of early morning volatility rather than new directional momentum.
Validation via Multiple Windows
Comparing the volume across the first fifteen minutes against the total volume of the overnight session provides additional context. A breakout that occurs with volume exceeding the average fifteen minute volume by a factor of three is a high conviction setup. Mechanical backtesting suggests that observing the volume through the sixty minute range helps confirm if the initial surge was a spike or a sustained shift in liquidity. Volume must remain elevated relative to the previous period to validate the direction of the trade.