Gap-to-Range Ratio
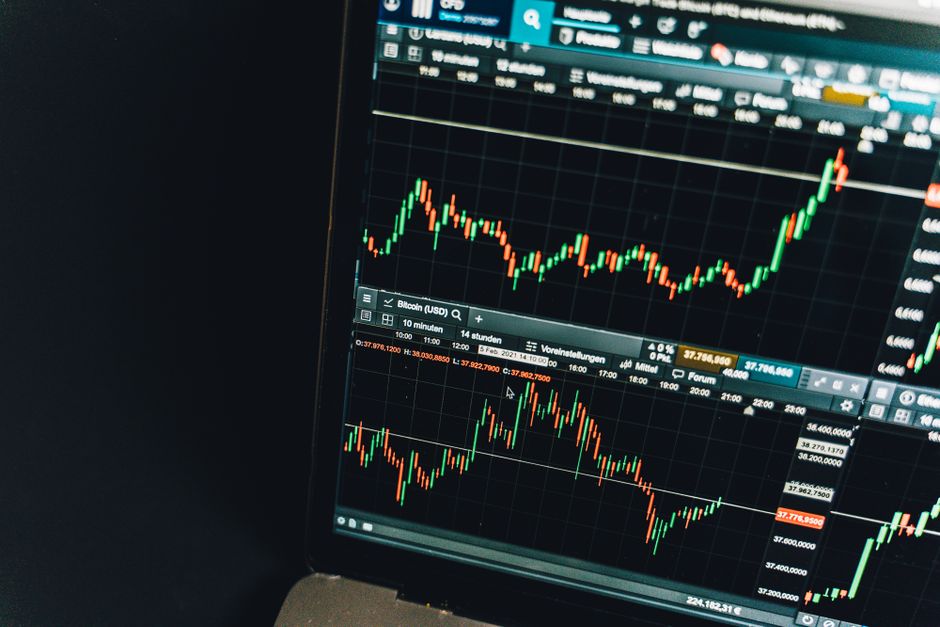
Ten percent of the total price movement in a standard intraday session often occurs within the first fifteen minutes of the market open. Every teardown orb trading stats tree63 has logged shows the same thing regarding the relationship between the premarket gap and the subsequent opening range breakout. The math dictates that a massive overnight session move followed by a tight five minute range creates a specific volatility profile. This mechanical relationship defines the probability of a trend continuation versus a mean reversion setup.
The Mathematics of the Gap
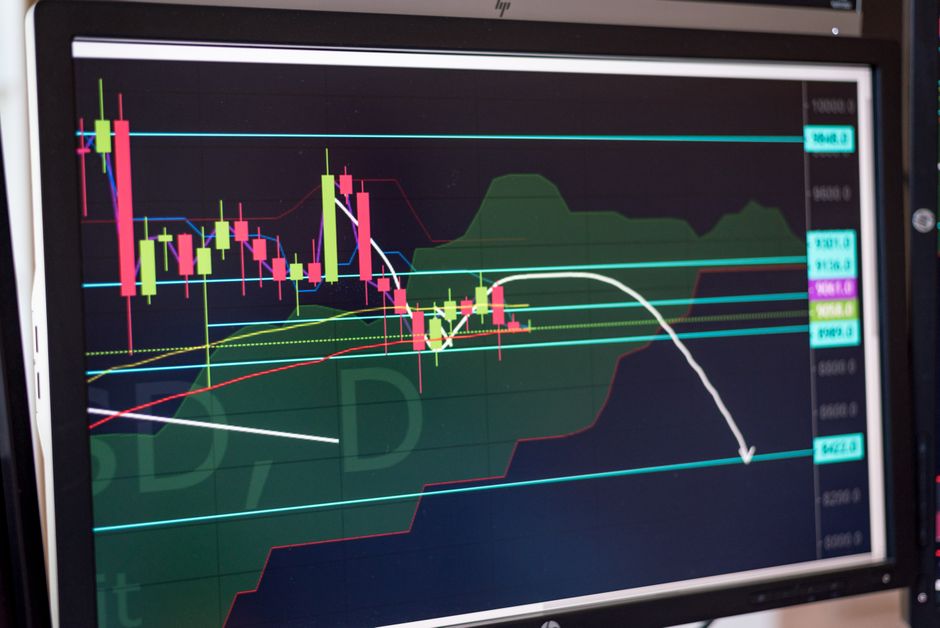
A gap size exceeding the average true range of the previous day signals significant overnight sentiment. When the gap is large, the initial price action during the first hour tends to be violent. If the gap is small, the opening range is often a period of consolidation. Measuring the ratio between the gap and the price expansion during the opening range provides a quantitative basis for trade selection. A large gap paired with a narrow fifteen minute range suggests a coiled spring effect. This specific combination often leads to a rapid expansion toward the session high or low.
Calculating the Ratio

The calculation requires two distinct variables. First, find the distance between the previous day close and the current market open. Second, find the high and low of the chosen timeframe, such as the thirty minute range. Dividing the gap by the range height reveals the exhaustion or momentum factor. A ratio above two indicates a heavy gap that may struggle to find buyers if the initial range is too wide. A ratio below zero point five suggests the gap is negligible compared to the local volatility. Data from the first hour shows that these ratios repeat with high frequency during regular trading hours.
Volatility and Range Expansion
Volatility expands when the price breaks the boundaries of the established orb. If the gap is large and the 5 minute range stays tight, the breakout potential increases. Conversely, a large gap followed by a massive opening range indicates that the overnight move is already priced in. In such cases, the price often reverses toward the previous day close. Mechanical execution requires waiting for the candle close outside the established zone. Relying on the ratio prevents entering trades where the move has already reached a point of diminishing returns.
Timeframe Selection and Accuracy
The choice of timeframe changes the ratio profile. A 60 minute range provides a more stable baseline for institutional direction. The 5 minute range offers more noise and frequent false breakouts. Most successful setups involve a convergence where the gap, the 15 minute range, and the 60 minute range all suggest the same direction. Discrepancies between these levels typically result in chop. Monitoring the ratio across multiple scales ensures the trade aligns with the broader intraday trend.