Failed Breakout Reversion Rate

After the first candle closes on the five minute range, the data for the failed breakout reversion rate begins to accumulate. The metrics recorded at orb trading stats tree63 show a higher frequency of false moves during the initial volatility of the market open. Tracking these specific failures allows for a mechanical assessment of how often an opening range breakout fails to hold momentum. Measuring this specific reversal pattern requires strict adherence to the defined boundaries set at the cash open.
Defining the Reversion Event
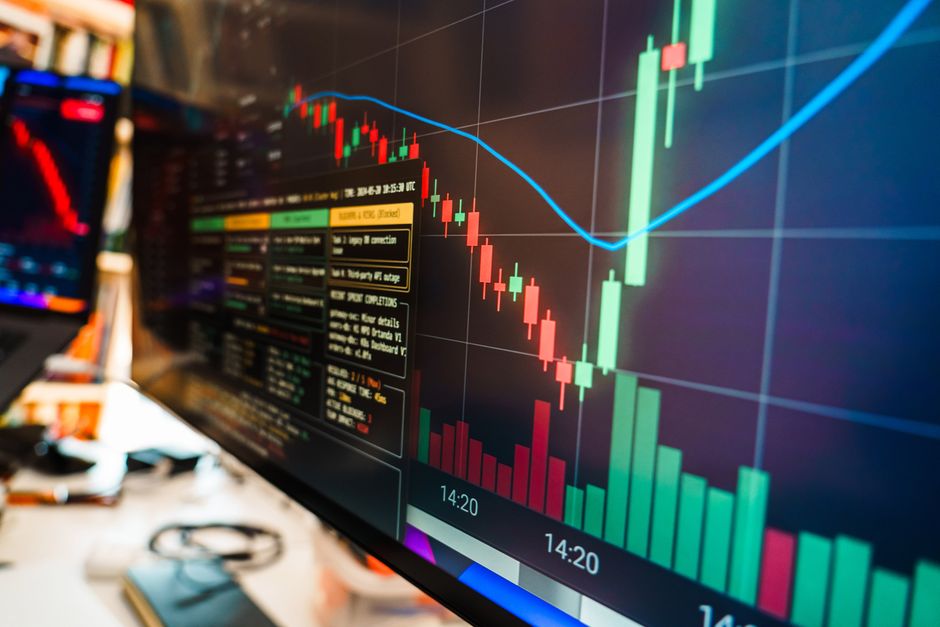
A failed breakout occurs when price pierces the high or low of the opening range but fails to sustain a position outside those levels. The reversion is measured by the distance and speed at which price returns to the interior of the range. This movement is not a trend change. It is a liquidity trap. Data shows that a significant percentage of breakouts during the first fifteen minutes lack the volume to sustain the move. The failure is confirmed when a candle closes back within the established boundaries of the initial timeframe.
Calculating the Reversion Rate
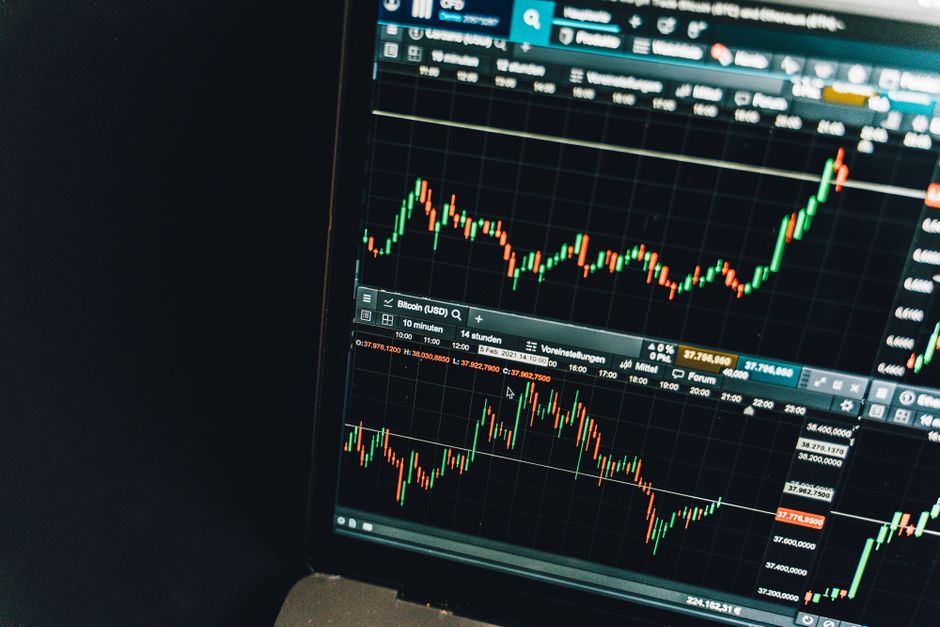
The rate is calculated by dividing the number of failed breakouts by the total number of breakout attempts. A sample size of one hundred sessions provides a baseline. If the fifteen minute range shows forty failures out of one hundred attempts, the reversion rate is forty percent. This number fluctuates based on the volatility of the overnight session. Higher overnight volatility often leads to wider ranges, which can decrease the frequency of these specific failed moves. The math remains constant regardless of the asset class.
Impact of the Timeframe
The choice of a thirty minute range versus a five minute range changes the statistical outcome. Smaller windows produce more frequent breakout attempts but also higher failure rates. A larger window, such as the sixty minute range, tends to capture more sustained directional moves. The reversion rate often peaks during the first hour of regular trading hours. As the session matures, the probability of a fakeout decreases as the trend establishes itself. The mechanical approach requires selecting one specific window and sticking to it for all calculations.
Volume and Reversal Velocity
Volume profiles determine the strength of the rejection. A failed breakout with low volume is a standard mean reversion. A failed breakout with high volume suggests a massive absorption of orders at the boundary. This absorption often leads to a rapid move toward the opposite side of the range. Monitoring the speed of the return to the session high or session low provides a measure of the reversal intensity. These metrics are recorded immediately following the close of the offending candle.
Data Integrity and Sample Bias
A small sample overstates the edge. Relying on a single day of data leads to incorrect conclusions about the reversion probability. The data must span several weeks of regular trading hours to account for different market regimes. Variations in volatility during the premarket can also skew the perceived strength of the opening range. Consistent logging of every breach and subsequent return is the only way to maintain an accurate statistical model.